Wednesday, May 30, 2012

Voter ID & Voting Rights Violations, Dallas County 5-29-12

The following sign was in the election packet for posting along with all the other signs for polling locations on election day, 5-29-12, in Dallas County:
Voter ID Signs in Dallas County 5-29-12
Other, black and white signs, in both Spanish and English, and in much smaller print, explained in detail that the Voter ID law was not in effect for this election.  Those signs listed all the forms of ID that were allowed. During 14 hours yesterday at my polling place I never saw anyone read those more detailed signs posted on the door.  Obviously, if the above sign had been posted, it would have been read much more frequently due to the larger size of the print, the short message, and the red color. 

Due to this high potential for the wrong message to be given, this sign was not posted at our polling location.  While literally correct, without more information it left the impression that a photo ID was required.  A formal complaint has been filed about the use of this sign.  More information is needed on this sign before it is posted again.

Sunday, May 6, 2012

Trinity River Tollway for Through Traffic: but at what cost?

Do you remember the promises made during the 2007 Trinity River Tollway Vote?  Politicians said it was already approved and paid for!

Photo taken in November of 2007 outside Beckly Courthouse voting locastion when two city council members were present and encouraging voters to vote "No."
(Right click to enlarge and/or print.)

Misleading campaign signs were a factor in the election. 
Which sign would you consider to be the most accurate?
The Trinity River Toll Road issue from 2007, after almost dying a natural death in spite of the close win in the 2007 election, has now been resurrected by Dallas Mayor Rawlings. Somehow the value of the 60+% of mixmaster traffic that is non-stop traffic through Dallas is pushing the cause.

This Tuesday evening, 5-8-12, there will be a NTTA (North Texas Tollway Authority) meeting at the Dallas Convention Center accepting public testimony regarding opinions on the value of this floodway toll road. The meeting starts at 7:00 PM, but from 5 - 7 PM, for two hours before that meeting, staff from the NTTA and exhibits will be available to answer all questions.  A map with free parking information is at http://www.trinityrivercorridor.com/pdfs/trinity-meeting-050812.pdf .

I will be there asking about estimated sound generated by the tollway and the current sound levels on the Trinity River.  How will the noise levels be affected by a tollway?  Has a sound map been created indicating the areas which will have significant noise increases?  Noise levels designated as unacceptable have already been documented in some NTTA maps but only in areas where there are current parks and residences.  There is no floodway area map with indications given of the sound increases anticipated in the currently unused areas, except for an occasional canoe.

The final question is: "Does Dallas want to sacrifice the last quiet place it has near downtown for the benefit of the large majority of current mixmaster traffic that is simply through traffic?"  Do suburban residents and truckers wanting to only drive through Dallas win, or can Dallas ultimately win?

If you are concerned about this floodway toll road, and want to join the movement against it, please google the three words: trinity river petition, and sign the simple one sentence petition against the floodway toll road.  This search will take you to http://www.ipetitions.com/petition/no-trinity-river-floodway-toll-road-in-dallas/ .  Please share this information with others you know of who may be concerned about protecting our city and the potential of our river to become a true world class park in the center of our city.

Do we need another election where choices are more clearly stated than in 2007?  Any second election demands that we have clarity in the meaning of each choice, as reflected in this modification of one sign from the 2007 election.


Please sign the petition and join with us on Tuesday at 7 PM at the Dallas Convention Center to give your opinion.  Your questions may be answered from 5-7, during the two hours just before the hearing.

Thursday, March 8, 2012

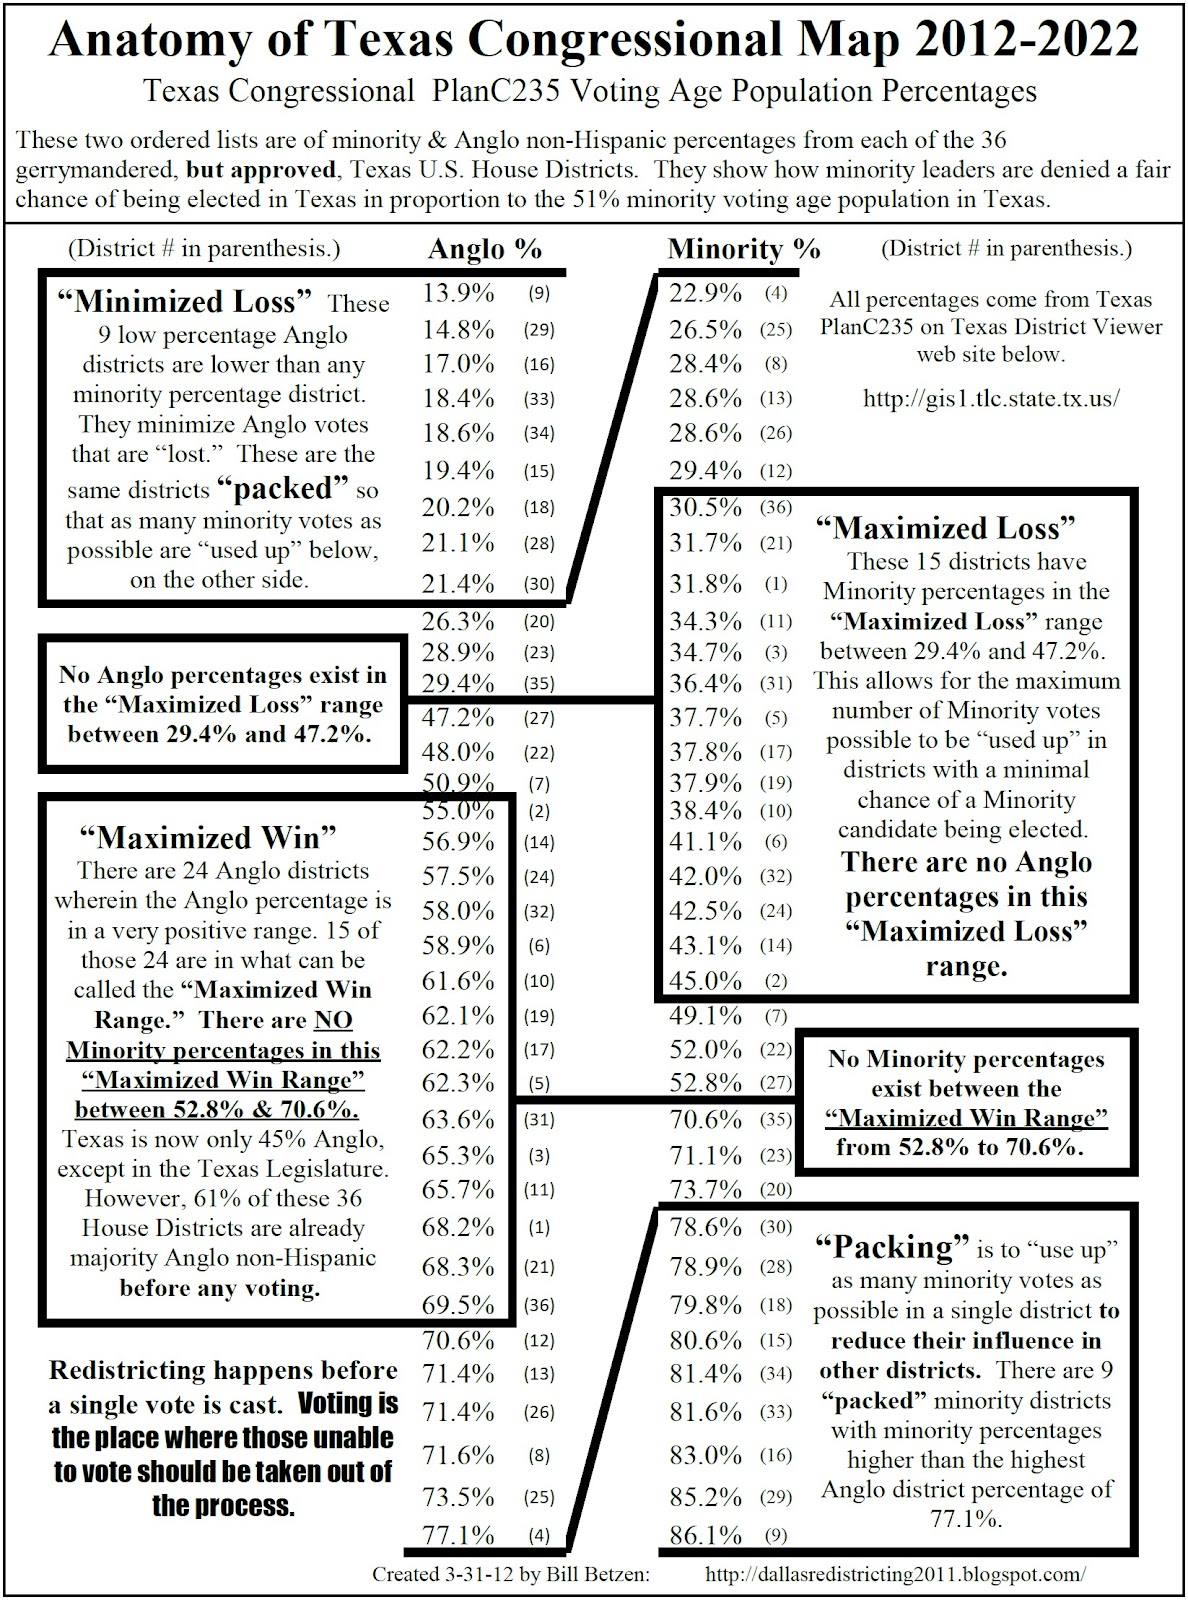
The Texas Congressional Map for 2012 to 2022

This chart is built around two ordered lists of the percentages of Anglo non-Hispanic population and of minority population in each of 36 new congressional districts in Texas. The minority percentage used is for all minorities, including Asian. This anatomy is done on C235, the redistricting plan mandated by the courts to replace C185 which was the plan passed by the Texas Legislature.  Plan C185 was thrown out by the first courts to review it.  Plan C235 was ordered by those courts to remedy this, but notice how bad C235 still is!!  On appeal the courts in Washington have now agreed with the lower court ruling and have judged PlanC185 to not have been drawn "without discriminatory purposes."    An anatomy of C185 has been completed and is now online at http://dallasredistricting2011.blogspot.com/2012/08/texas-congressional-redistricting-plan.html .
Anatomy of Texas Congressional Map for 2012-2022
Right-click to enlarge and/or print.
Except for the Texas Legislature itself, Texas is only 45% Anglo. But, due to classic gerrymandering, Anglos are the majority in 61% of districts, before there is even an election.  In elections Anglo percentages have historically gone up due to both the legal inability for some minority residents to vote combined with apathy induced by generations of adverse gerrymandering against minorities, such as that illustrated in these charts.  This history is combined with other methods used over the generations to discourage minority voting, most of which have since been declared unconstitutional. Voter-ID laws in Texas are now planned to add to the collection of methods used to minimize minority voting. 

While there are no districts with Anglo percentages in the "Maximize Loss" range between 47.2% and 29.4%, there are 15 minority districts with percentages in that same "Maximize Loss" range.  See the chart above.  In a similar manner, while there are no minority percentages between the most favorable section of the "Maximized Win" range from 52.8% to 70.6%, there are 15 districts with Anglo percentages in that most favorable range. Why? 

Could this have happened by accident?

The scattergraph below is another illustration of this same gerrymandered manipulation of Texas Congressional Maps.  It will continue to deny equal representation to minorities until 2022.
Scattergraph of Gerrymandered Texas Congressional Map, PlanC235
Right click above chart to enlarge and/or print.
Each column in the scatter chart above represents one of the 36 Congressional Districts in Texas. The large square blocks, representing the Anglo non-Hispanic, percentage, are concentrated either in the “Maximized Win" range from 52.8% to 70.6% inclusive to most efficiently use their votes, see #2 above, or in the “Minimize Loss” range below 22.9%. See #4 above. Meanwhile the red diamond markers for minorities are generally in less than optimal ranges. They are either bunched in the “Packed" range above 77.1%, see #1 above, or in the central “Maximize Loss" range between 47.2% and 29.4% where the highest percentage possible of minority votes are “used up” without electing a minority candidate. See #3 above. 
 
Please print and share the above charts with anyone interested in voting rights and equality of opportunity.  Both these charts were made from demographic data on the U.S. House Districts created and approved by the Texas Legislature.  This data is from PlanC235 found in the Texas DistrictViewer, online at http://gis1.tlc.state.tx.us/.  The above charts were done in an attempt to illustrate the evil that "gerrymandering-gone-wild" has again done to Texas for the next decade.

In 2020 our nation will start another redistricting process.  Hopefully every jurisdiction will have the redistricting process online and available to citizens so that everyone can more easily see what is happening.  Transparency is our best weapon in the war against gerrymandering.  But it will only work if more citizens are involved.

Questions are welcome, especially if any technical errors are noted on these charts, or if you want a pdf copy of these charts for a better quality print.
Bill Betzen
bbetzen@aol.com

Saturday, January 21, 2012

Irving Texas Education Coalition: 5-2 vs 7-0

On 1-19-12 the Irving Education Coalition held a meeting to coordinate efforts to fight the vote of the Irving School Board to establish a 5 single member district voting system with two at-large districts to select the 7 members of the Board.  It was a positive meeting with the following handout passed out containing two copies of maps to use in comparing the 5-2 and 7-0 systems.  Here is page one:
Page one of Irving Education Coalition Handout 1-19-12
(Right click on above image to enlarge it or save a copy.)
Page two of the handouts included demographic spreadsheets for both the 5-2 and 7-0 systems so as to compare in detail what the differences are.  Here is page two:
Demographic differences between 5-2 and 7-0 redistricting plans for Irving ISD.
(Right click on above image to enlarge it or save a copy.)
 These handouts provide documentation to support the 5 main points comparing the 5-2 plan with the 7-0 plan.  Our students should see democracy in action with this battle over at-large districts and single-member districts.  They also need to see the vital lessons as to how democracy can be denied by gerrymandered redistricting.

Monday, January 16, 2012

Justice in Irving ISD: Comparing 5-2 with 7-0

Five single member & two at-large districts vs seven single member & no at-large districts


On 1-12-12 the Irving ISD School Board, with a 3 to 4 split vote, denied voters a 7 single member district system for the selection of members for the school board.  Instead they selected a 5 single member and 2 at-large member district system.   This system has the following characteristics:

1) The 5-2 system will not allow for a single district wherein Black residents are the largest group.  This is possible in a 7-0 system in Irving ISD

2) The 5-2 system virtually guarantees that the School Board will remain under the contol of Anglo non-Hispanic members. This is in a School district with only a 10.7% Anglo non-Hispanic student population and a 29.99% Anglo non-Hispanic resident population. With the 5-2 district map submitted by the IISD Board there are only three districts wherein there is any statistical improvement for the Irving minority population as a unified group to have any increased advantage in electing a candidate of their choice. In the 7-0 map submitted by the Irving Education Coalition there are 5 such districts, a significant improvement in the potential for the Irving minority community to elect candidates of their choice, and a probable majority on the IISD Board.

3) The 5-2 system creates an unequal situation for two board member positions by continuing the burden for them of the expensive citywide campaigning. These two positions must connect with a population of over 170,000 people while the other 5 single member positions will have significantly less expensive campaigns targeting populations of only 34,000 people. These positions all have equal votes on the board.

4) The 5 single member district campaigns for office will be more expensive in time and money than those for 7 single member districts. There is a big difference between the need to connect with populations of over 34,000 people in the 5 district system and the need to connect with the smaller communities of 24,000 people in the 7 district system. The campaign for office in a 7-single member district system could much more easily be based on personal connections. Success in being elected can much more easily depend on effort and reputation, not on money. Plus, all the members in a 7-single district board of trustees would truly be equal, representing equal numbers of the population.

5) A majority Hispanic CVAP (Citizen Voting Age Population) district is not possible without a 7-0 district system! The court order signed by Judge Fitzwater in January of 2010 stated that once a district with a majority Hispanic CVAP could be proven, that the move to single member districts could happen without a return to court being necessary. With 7 districts such a majority Hispanic CVAP district has been created.  Such a district is not possible with 5 single member districts.

6) A 7-0 single member district system will obviously most encourage local involvement.  It will provide the greatest potential for personal connections in the Irving ISD system.  Parents will know that their board member has their local interests in mind.

7) A 7-0 single member district system will also encourage local parental involvement, the goal of all schools.  Local involvement of the community is what our schools most need to motivate students to work hard toward their own graduation, well prepared for work and/or college.

Saturday, January 14, 2012

Enrollment and Board Profiles for 14 Dallas County Independent School Districts

Right click to enlarge or save a copy.
The above chart is for the 14 largest independent school districts in Dallas County, Texas. It is made up of data pulled from the Texas Education Agency data base online for the 2010-2011 school year enrollment.  The board information was pulled from the web sites for each of the respective school districts.  Board ethnic distribution was based on photographs online, personal knowledge, and Hispanic surnames, and therefore is not fully reliable.

Saturday, January 7, 2012

Irving ISD, Irving, Texas - Demographics

Media coverage erroneously suggested that the percentage of the IISD student body who are Anglo is over 15%.  It is only 10.74%.  Below are numbers released by IISD on 12-9-11:

This fact, combined with the 29.99% Anglo population now living in the area served by IISD, and a current school board with no setting minority members,  mandate the need for a 7-0 form of single member district selection for board members.  This would encourage greater citizen involvement and increase the potential for representation that reflects the community. 

On Thursday, January 5, 2012, the Irving ISD Board accepted testimony from the public related to decisions to be made about possibly moving to single member districts for the election of the 7 school board members. Over 60 people were present.  When those wanting no change from at-large districts were asked by a similarly minded speaker to stand, based on the video shown on the Channel 11 evening News, only 7 people stood up.  This means that a total of 8 people, from the 60+ present, wanted no change.  The support for a change to 7 single member districts appears very strong. The next two IISD Board meetings for public input on this potential change for IISD begin at 7 PM Monday and Tuesday nights, 1/9/12 and 1/10/12.  Monday's hearing is at MacArthur High School.  Tuesday's hearing is at Nimitz High School.